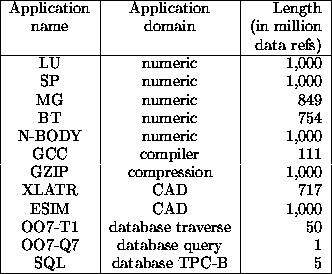
We choose to visualize the working sets of several applications that are representative of long-running computations on large data sets:
The characteristics of the applications are summarized in the following table:

We executed the above benchmark applications on top of the ATOM tracing environment [5] (apart from the SQL application for which we had the traces already available [4]), running on top of Digital UNIX V3.2D-1. To keep the tracing times reasonable, long running applications were run as long as necessary to collect one billion data references, which correspond to several billion instructions.
The working sets of the applications are shown in figures
1 to 12. Figures 1
to 9 have two views of the
working set: The first one presents the memory
access pattern of the application.
This access pattern is calculated as follows: Time is divided in intervals
(usually 2 million data references long). For each page accessed at least
once, we plot a dot on the respective interval that the page was accessed.
Thus, each dot in the figure
corresponds to at least one access
to a (4-KByte) page done sometime during a
2-million-references interval  .
For example, in figure 1 we see that most of the pages
the LU application accesses range between 262000 and 268000.
In most figures we also plot the size
of the working set for each time interval.
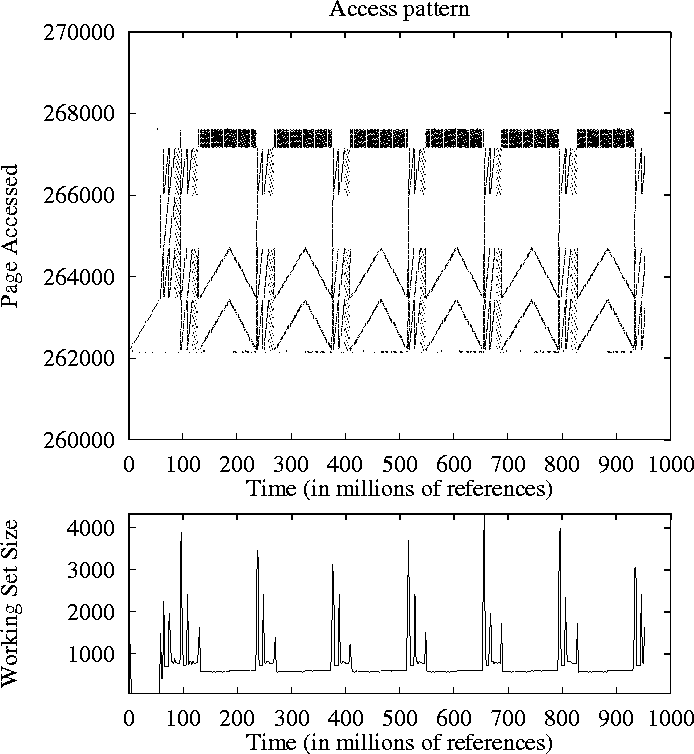
Figure 1: Access Pattern and working set size of LU
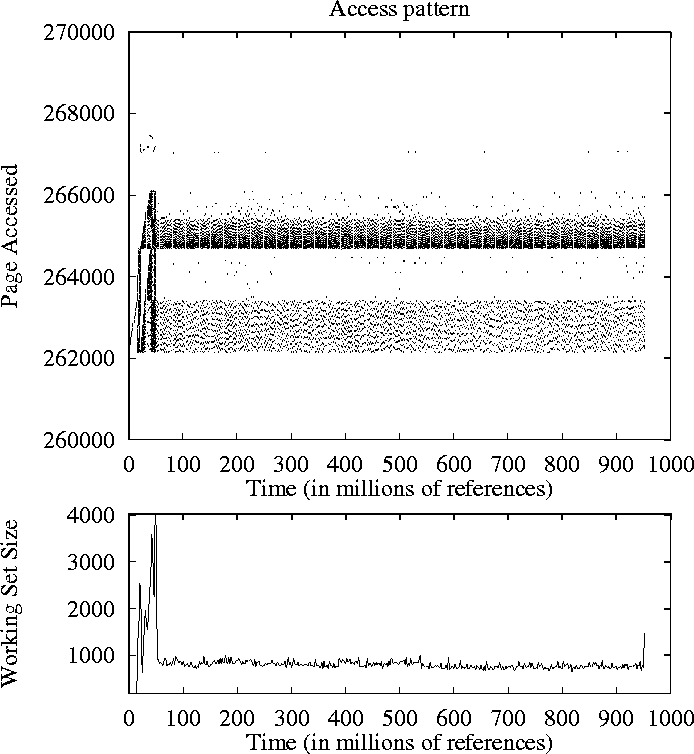
Figure 2: Access Pattern and working set size of N-BODY simulation
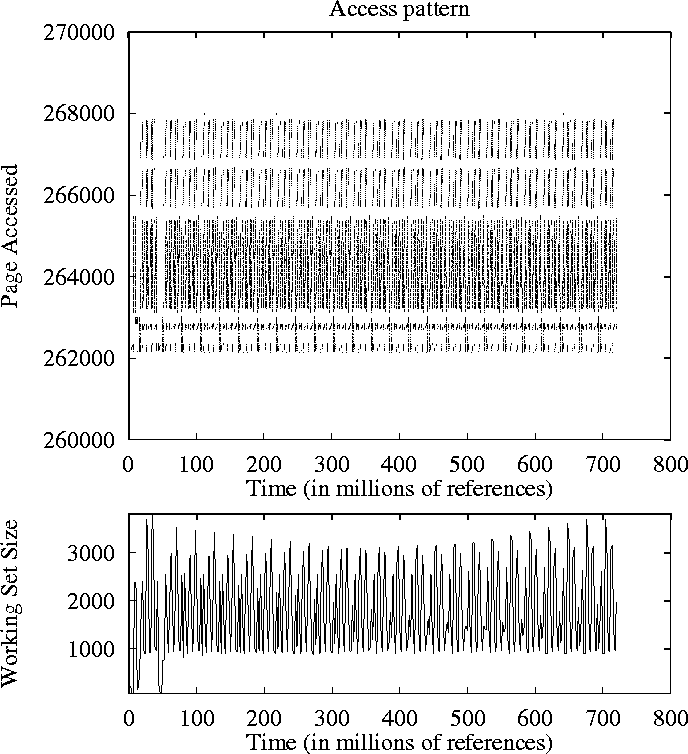
Figure 3: Access Pattern and working set size of BT
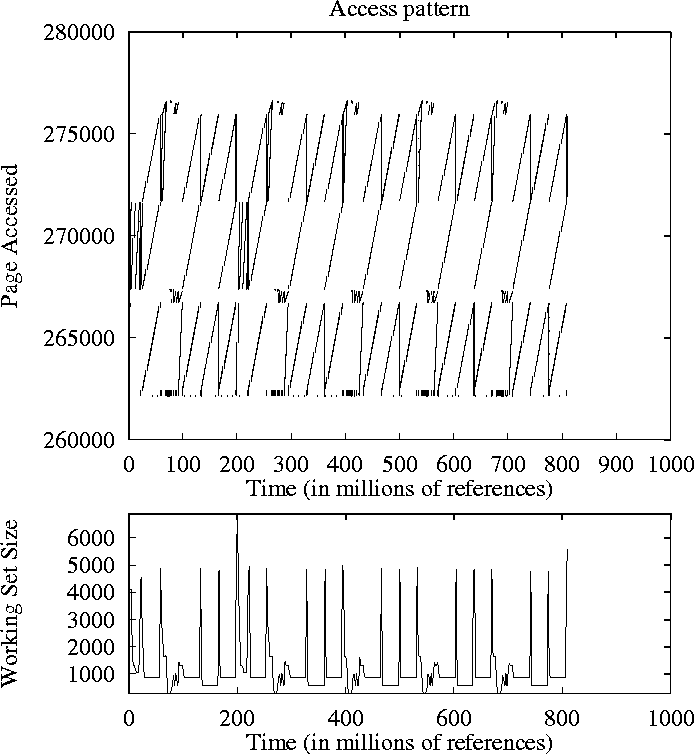
Figure 4: Access Pattern and working set size of MG
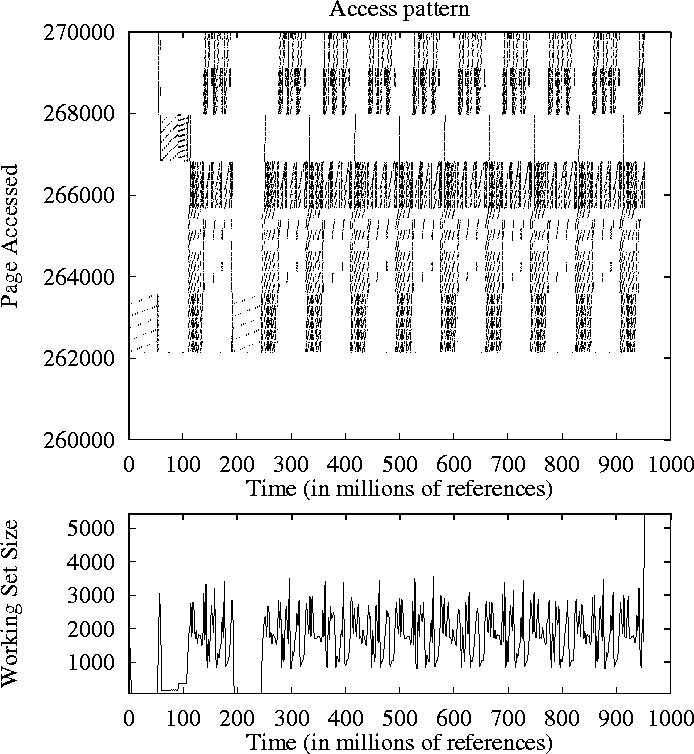
Figure 5: Access Pattern and working set size of SP
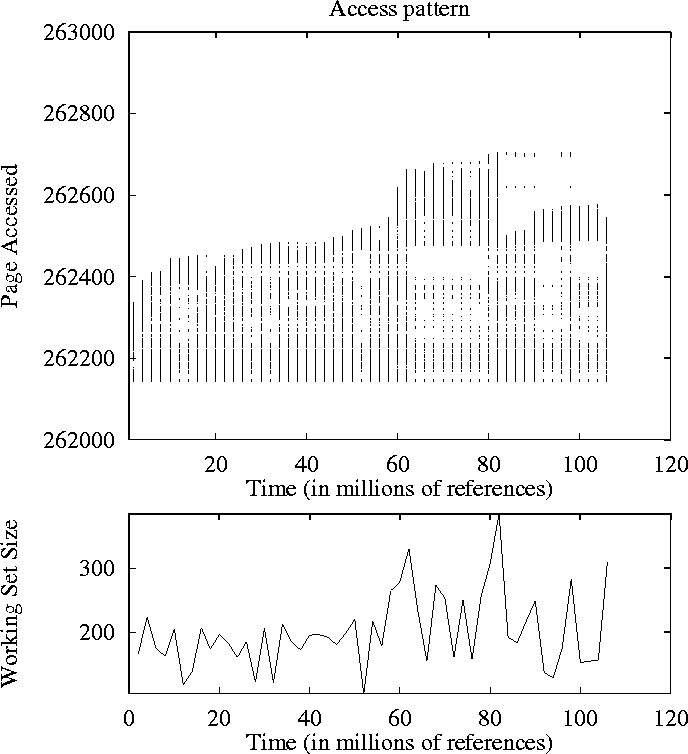
Figure 6: Access Pattern and working set size of GCC
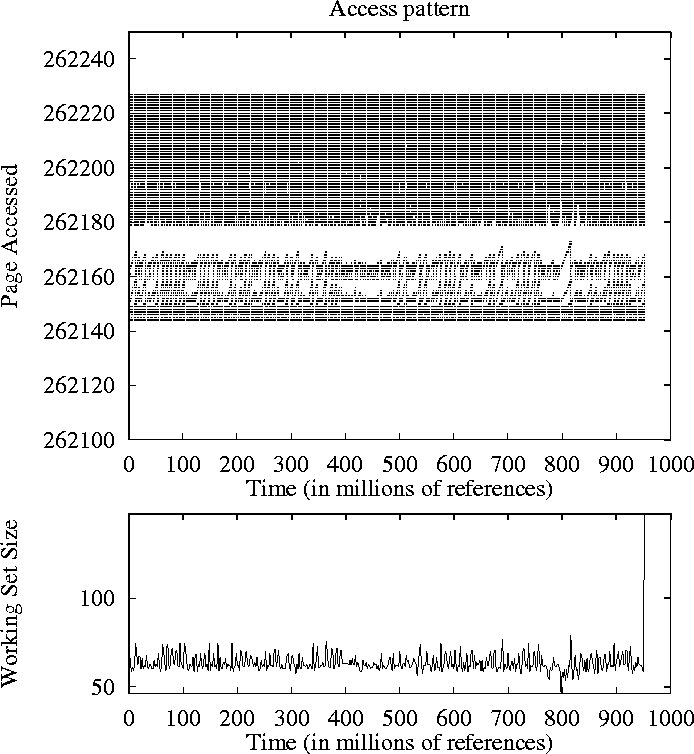
Figure 7: Access Pattern and working set size of GZIP
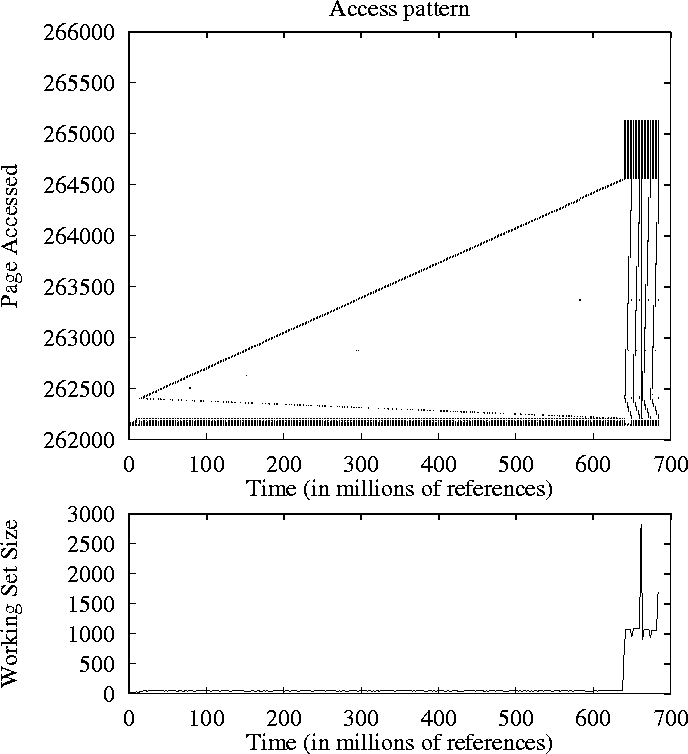
Figure 8: Access Pattern and working set size of XLATR
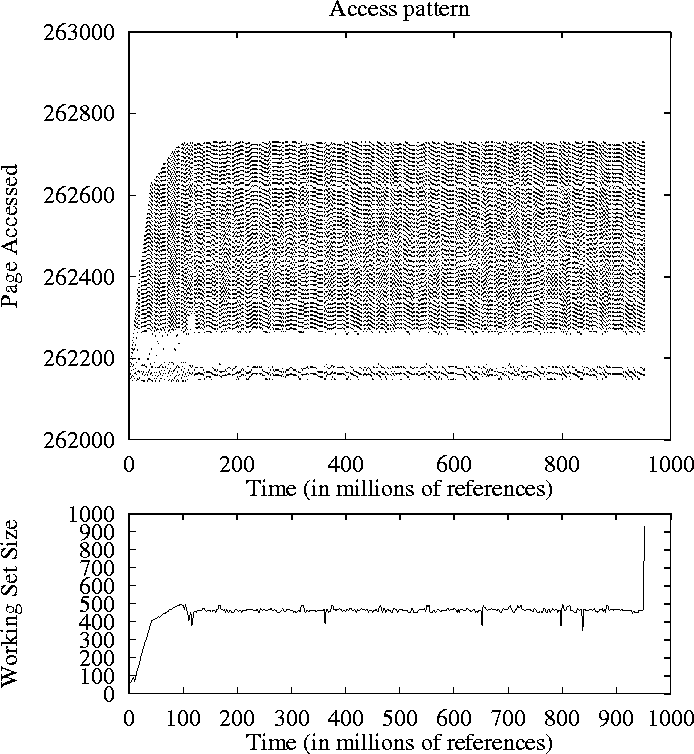
Figure 9: Access Pattern and working set size of ESIM
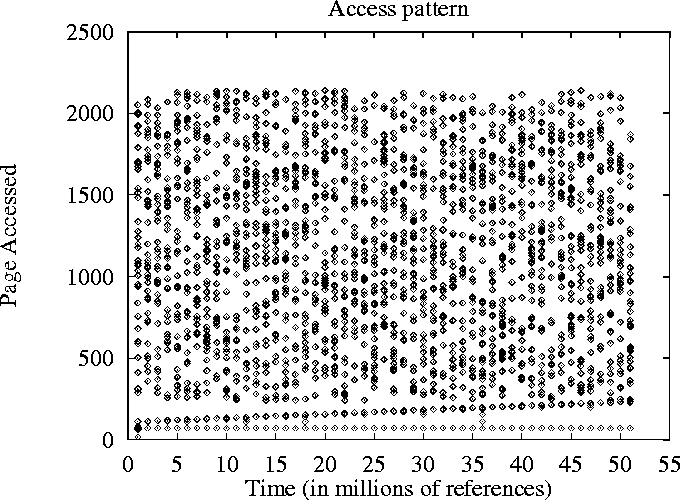
Figure 10: Access Pattern and working set size of OO7 T1
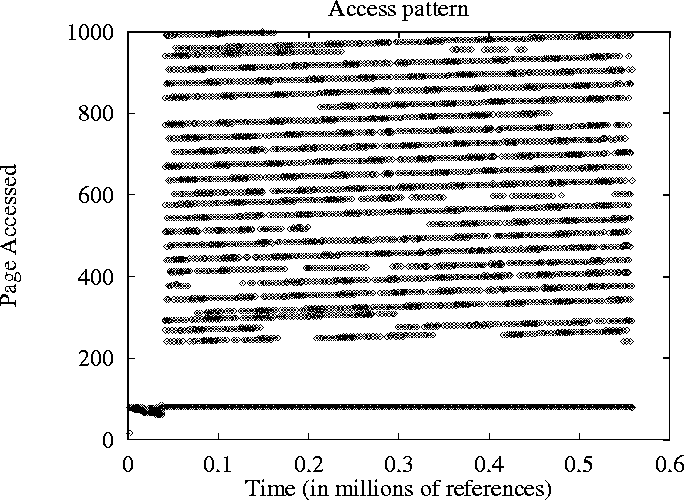
Figure 11: Access Pattern and working set size of OO7 Q7
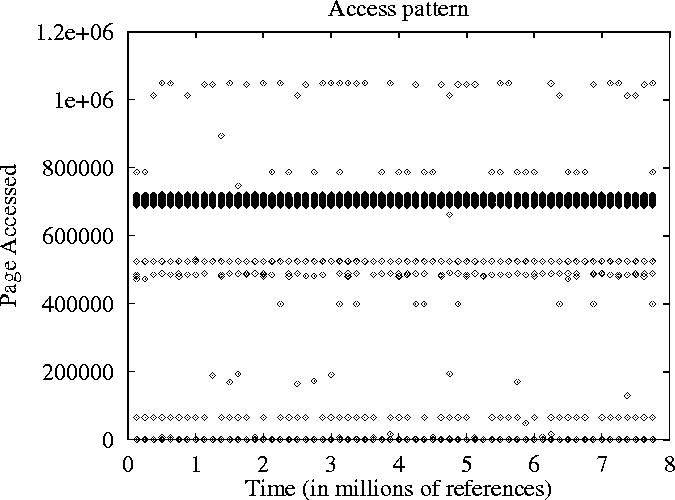
Figure 12: Access Pattern of SQL